EpsilonWriter Web and Creator
Curves drawing manual
17th January 2017
1. Curves drawing and animation with EpsilonWriter Web
EpsilonWriter Web plots curves and animated curves (depending on a parameter).
1.1. Curve drawing
Function drawing
Write an expression of the x variable alone or in an equality like 


The cursor being in the formula, select the drawing keyboard if needed ("Draw" button) then touch a colored button. That produces something like this, for instance:
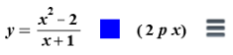
To draw the curve, just touch the colored button on the right of the function.
2px is the thickness (2 pixels), to change the value, replace 2 by another digit or use the px button (when the cursor is in this formula).
Parametric curve drawing
It is possible to enter the formula of a parametric curve, for example:  preferably with an interval for the parameter, like:
If no interval is provided, the interval  is used.
A well-chosen interval allows a faster drawing or drawing only a relevant part of the curve.
Polar curve drawing
It is possible to enter the formula of a curve with its polar equation, for example:  preferably with an interval for θ like:
If no interval is given, the interval  is used.
A well-chosen interval allows a faster drawing or drawing only a relevant part of the curve.
Drawing a predefined shape
There are 4 predefined shapes:
 draws a segment from point
  to point
  . Enter seg to get the segment operator
 draws a square centered on point and with a c side length. Enter square to get the square operator
 draws a rectangle with a diagonal from the point to the point . Enter rec to get the rectangle operator
 draws a circle with its center and r radius. Enter circle to get the circle operator
Zoom accuracy
The display of segments and rectangles keeps the zoom with accuracy, even if you apply different zooms to x and y
The display of squares and circles does not keep the zoom when you apply different zooms to x and y : visually, the squares remain squares and circles remain circles. To draw squares with different zooms for x and y, use the rectangle operator, change for  .To draw circles with different zooms for x and y , use a formula, change for
  or for
Translation
The expression  make the figure do a translation of a for the x and b for the y
Limitation
It is possible to set some limitations for the drawing of the functions, polar and parametric curves by adding conditions, for example with  or
or  you get:
Do not set limitations on the predefined shapes operators.
Limitations are done after translations, even if they are written before.
Several curves
It is possible to get several curves to draw in a document.
Using the menu on the right of the formula you can, among other things, draw a curve above those already drawn and draw all the curves.
It is possible to group several curves to be drawn in an array, making a false animation, for example:
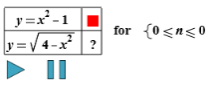
See below the animations of curves. There is no real animation above because the parameter n takes only one value.
Zoom and menu panel
The panel with the zoom and a menu appears/disappears when you touch the graphic. When you touch "zoom", you get a panel for the zoom with a xy button to separate zooms on the x and the y . With the menu you can display/hide the grid, display/hide the document.
1.2. Animation of curves
Put the cursor at the beginning of a white line and switch to math ("Math" button from the virtual keyboard). Select the draw keyboard if needed (with the "draw'" button) then touch the Animate button.
You get this:
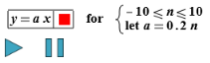
It's an example to modify. On the left of "for", there is a function of the variable x in a mathematical table. It depends on the a parameter. On the right of "for", there is the definition of the main parameter ( n here), which is an integer between two bounds and calculations that can express the parameters that are used in the functions.
In this example, you can:
- change the function, add functions, remove a function,
- set a color for each function by putting the cursor in the formula and touching a colored button from the drawing keyboard,
- set a thickness for each function by putting the cursor in the formula and touching the px button from the drawing keyboard,
- change the calculation of the parameters.
To add a line to the table, use the "Enter" key.
To delete a line of the table, delete the content of the left cell then do a backspace.
To set or change a color, use the colored buttons of the "Draw" palette (the default color is blue). To set the thickness, use the px button of the "Draw" palette (default thickness is 2).
You can enter parametric or polar curves, and also drawing operators in the list of curves to draw. You can use translations and limitations.
The  button start the animation, the
  button pause it. In both cases, the functions are drawn and the caption is displayed.
Caption
The caption appears/disappears as you touch the graphic panel.
Here is a caption example:
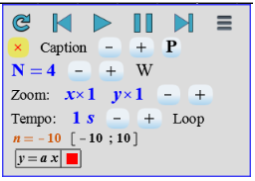
The first line includes the animation buttons and a menu. With the menu you can set the display parameters (they also can be set as described below), clear the graphic, display/hide the grid, display/hide the document.
In the second line, the buttons can be used to close the caption panel, display more or less details and display or not the display parameters (P button).
The line 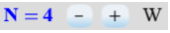 shows the persistence and enables its change (click on - + or
  ). If
). If  the function is displayed for its parameter current value and also for the 3 previous values.
After the + button there is the gradient code which is applied when there is a persistence: M0 means no gradient, W for a gradient to the white, CO for a gradient to the complementary RVB, M1 and M2 are for a gradient to another color. Clicking on this code, you get it changed to the next code.
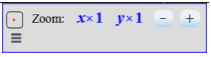
Use the line  to set the zoom (click on - + or Zoom). With a click on Zoom, there are more possibilities available, including separate zoom on the x and zoom on the y .
Use the line 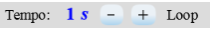 to set the tempo. The displayed value is the expected duration in second between two displays. To change it, click on - + or Tempo. After the +; there is the "Loop" indication (when the last value of the main parameter is reached, the animation restarts) or "Once".
The line  displays the current value of the main parameter and the actual duration from the previous display. It can be greater than the tempo duration when the tempo is small and lots of functions are drawn.
A bar indicates the progression, at the bottom of the graphic.
2. Drawing and animation of functions with EpsilonWriter Creator
2.1. Drawing a function
The process is similar to the one of 1.1. but when you ask for a display, EpsilonWriter Creator asks if you would like to display in the web browser. If you answer "no", nothing is displayed. If you answer "yes", the functions are sent to EpsilonWriter Web in the web browser to be displayed.
2.2. Animation of parametric functions
The process is similar to the 2.1. one but when you ask for a display with the  button from the document, EpsilonWriter Creator propose the display in the web browser. The
  displays the caption and so enables parameter settings like in 1.2.
2.3. Saving on epsilon-publi
These documents with curves to draw or animate can be saved on the epsilon-publi website as any document made with EpsilonWriter Creator. Thus everybody can use them. When they are saved in a "read only" mode, the document is not displayed, only the graphic is with the curves drawn or the animation started.
2. Add/delete lines of the tableau
To add/remove rows from the table, use the "Table" menu commands or the shortcuts shown in this menu.
3. Complements
Some open sources files are available on the website: functions drawings animated curves
To get the sources of a resource and put them in EpsilonWriter Creator, click on "Description" then follow the guidelines at the bottom of the page to transfer the source code in EpsilonWriter Creator. When pasting, answer "yes" to the question "Open in author mode".
It is possible to create greeting cards, with animation and texts displayed in the animation. In the gallery of cards , various cards are proposed with quickly customizable texts. The manual for cards gives explanations for an advanced creation of new cards.